UU_QAMD
vip
Age3.8Year
Peak Tier0
No content yet
#BTC#
#BONK#
🚀🔥✅$BONK price analysis from current trend and market data sentiments.

✅🔥 Figure-1 chart displays that if $BONK fails to break resistance of descending channel then the price may dump but still remains within the channel and it is possible BONK will rebound from support of the channel. Bounce from support may be quite strong and it may break the upper resistance of the descending channel and price continue to move upward. $BONK already rises 150% approx. within the range of descending channel from the recent dump of the market.
✅🔥 Figure-2 shows that $BONK is testing resi
BTC-1.7%
BONK-1.82%
MEME1.69%
post-image
post-image
  • Reward
  • 1
  • Share
#SHIB#
✅$SHIB price analysis from current market data.
✅🔥 Figure-1 depicts that SHİB is currently testing and bouncing near resistance zone of descending channel. If it fails to break the resistance then it may be possible it will retest the central support zone of the channel from where prices may bounce and after which the price will possibly continue to move upward with a range of $0.00008-0.0001. Shib is showing good movement and already up 70% from the recent dump.
✅🔥 Figure-2 chart displays that if $SHIB fails to break resistance of descending channel then the price may dump and touc
SHIB-1.24%
FLOW-1.03%
post-image
post-image
  • Reward
  • 1
  • Share
UU_QAMDvip:
Please press follow for more updates and information. Hope those who read press follow button for motivation. thank you and appreciation for all.
#BTC#
🔥🔥$BTC price analysis from current market trend.🔥🔥
✅ Figure-1 shows that #BTC# on the central support of descending channel represented by dashed line. If $BTC breaks the current zone it might test bottom support of the channel. If bulls are able to hold the support line then the price will possibly rebound and continue to move upward.
✅ Figure-2 chart displays that if $BTC remains within channel and it is highly possible it will rebound from support of the channel and breaks the resistance of the descending channel and price continue to rise upward.
Also in case, if Bitcoin is un
BTC-1.7%
BAND-2.12%
IDEA-11.5%
post-image
post-image
  • Reward
  • 1
  • Share
UU_QAMDvip:
Please press follow for more updates and information. Hope those who read press follow button for motivation. thank you
#AVAX#
🔥✅$AVAX price analysis from current market trend.
✅🔥 Figure-1 shows that $AVAX is testing resistance zone of descending channel. If it breaks the resistance successfully then it may possibly retest the horizontal support zone once again as shown in the figure after that the price will possibly continue to move upward direction with range $70-$80. A good opportunity for those who are waiting for long entry.
✅🔥 Figure-2 chart displays that if $AVAX fails to break then the price may fall but still remains within channel and it is highly possible it will rebound from support of the chan
AVAX-1.98%
IDEA-11.5%
BTC-1.7%
post-image
post-image
  • Reward
  • 1
  • Share
UU_QAMDvip:
Please press follow for more updates and information. Hope those who read press follow button for motivation. thank you
#TIA#
🔥🚨$TIA future price analysis from trend.. Two different cases have been studied and presented in our analysis.
✅🔥 As shown in figure-1, The price of $TIA is moving down towards the lower support of descending channel, if it rebounds from support then it may possibly break the resistance of descending channel and on retesting horizontal support zone, the price might goes upward in the direction of $15-$20. A good opportunity for those who are waiting for long entry.
✅🔥 Figure-2 depicts that if $TIA breaks the support of the descending channel then the price might dump towards the $5-$
TIA-2.84%
IDEA-11.5%
BTC-1.7%
post-image
post-image
  • Reward
  • 1
  • Share
UU_QAMDvip:
Please press follow for more updates and information. Hope those who read press follow button for motivation. thank you
#SOL#
🔥✅$SOL future price analysis from current trend.
✅🔥 Figure-1 chart displays that if $SOL continue to move in descending channel for some time. It may be possible that it breaks the support of the descending channel then the price might dump towards the $85-$110 zone. A good opportunity for short sellers to have a position.
✅🔥 As displayed in figure-2 chart, The price of $SOL is moving towards the resistance of the descending channel. It needs buyers volume to break that resistance, if it breaks that then it may possibly retest the horizontal support zone, the price might go upward i
SOL-3.09%
IDEA-11.5%
BTC-1.7%
post-image
post-image
  • Reward
  • 1
  • Share
UU_QAMDvip:
Please press follow for more updates and chart. Hope those who read, press follow button for motivation. thank you
#BTC#
✅ Fact and data check. 🔥🚀
Crypto Ownership by Country according to TripleA global data.Only top 20 countries are listed here.
Rank Country Pop. % of Pop. owning Crypto
1 🇮🇳 India 1.429B 7.23% (103m)
2 🇨🇳 China 1,426B 4.08% (59m)
3 🇺🇲USA 340m 13.22% (44m)
4 🇻🇳 Vietnam 98m 20.54% (20m)
5 🇵🇰 Pakistan 240m 6.40% (16m)
6 🇵🇭 Philippines 117m 13.02% (15m)
7 🇧🇷 Brazil 216m 6.98% 15m
8 🇳🇬 Nigeria 224m 5.75% 13m
9 🇮🇩 Indonesia 2
BTC-1.7%
POP-4.24%
post-image
  • Reward
  • Comment
  • Share
#FET#
✅📊💰📝🔥$FET price movement analysis using descending channel.🔥💵💸💰📉📈
currently $FET moving along the descending channel. Usually the descending channel indicator is for short seller traders who understand its pros. and cons. Here we presented two possibilities: how it usually plays out.
i) Figure 1 displays that if $FET in a descending channel fails to break out then it will fall sharply in downward direction and touch the lower part of the channel if held then rebound. If the break out fails on touching the upper channel then price will fall hard in the lower direction.
ii) Fig
FET-3.54%
PROS13.44%
post-image
post-image
  • Reward
  • Comment
  • Share
#FTM#
$FTM price analysis using movement in descending channel with historical data.
$FTM is moving a descending channel after hitting the local top.
There are two possible actions for future price movement. These two cases are shown in figures. These different possible outcomes are based on the descending channel indicator historical movement analysis.
i) $FTM break out and retest local support created in the descending channel and move in an upward direction which is a good opportunity for those who are long buyers as they need to wait for confirmation of retest before any possible upward m
BTC-1.7%
post-image
post-image
post-image
post-image
  • Reward
  • Comment
  • Share
#INJ#
📉 Ride the wave of $INJ's downward trend within a captivating descending channel! Here's your ticket to trading success:
1️⃣ **Short-Selling Sweet Spot:** Lock in profits by selling near the upper channel boundary, capitalizing on the bearish momentum.
2️⃣ **Trend Reversal Thrill:** Keep your eyes peeled for a breakout above the upper trend line, signaling a potential shift in the tide and a chance to ride the bullish wave.
🛑 **Safety First:** Navigate the market with caution and smart risk management. Add some extra flair with momentum oscillators like RSI and Stochastics.
Stay sharp,
INJ-3.07%
RIDE-0.18%
NEVER-6.26%
post-image
post-image
post-image
  • Reward
  • Comment
  • Share
#BTC#
✅🔊🚨$BTC price movement analysis using data and facts.
1. **Long-term Holders' Profits**: Long-term holders of Bitcoin, holding for over 150+ days, have achieved an unrealized profit of more than 200%, emphasizing the benefit of patience in the crypto market.
2. **Mining Firms Holding Bitcoin**: Top five mining firms are holding onto their Bitcoin resulting in a drop in sales to a two-year low.
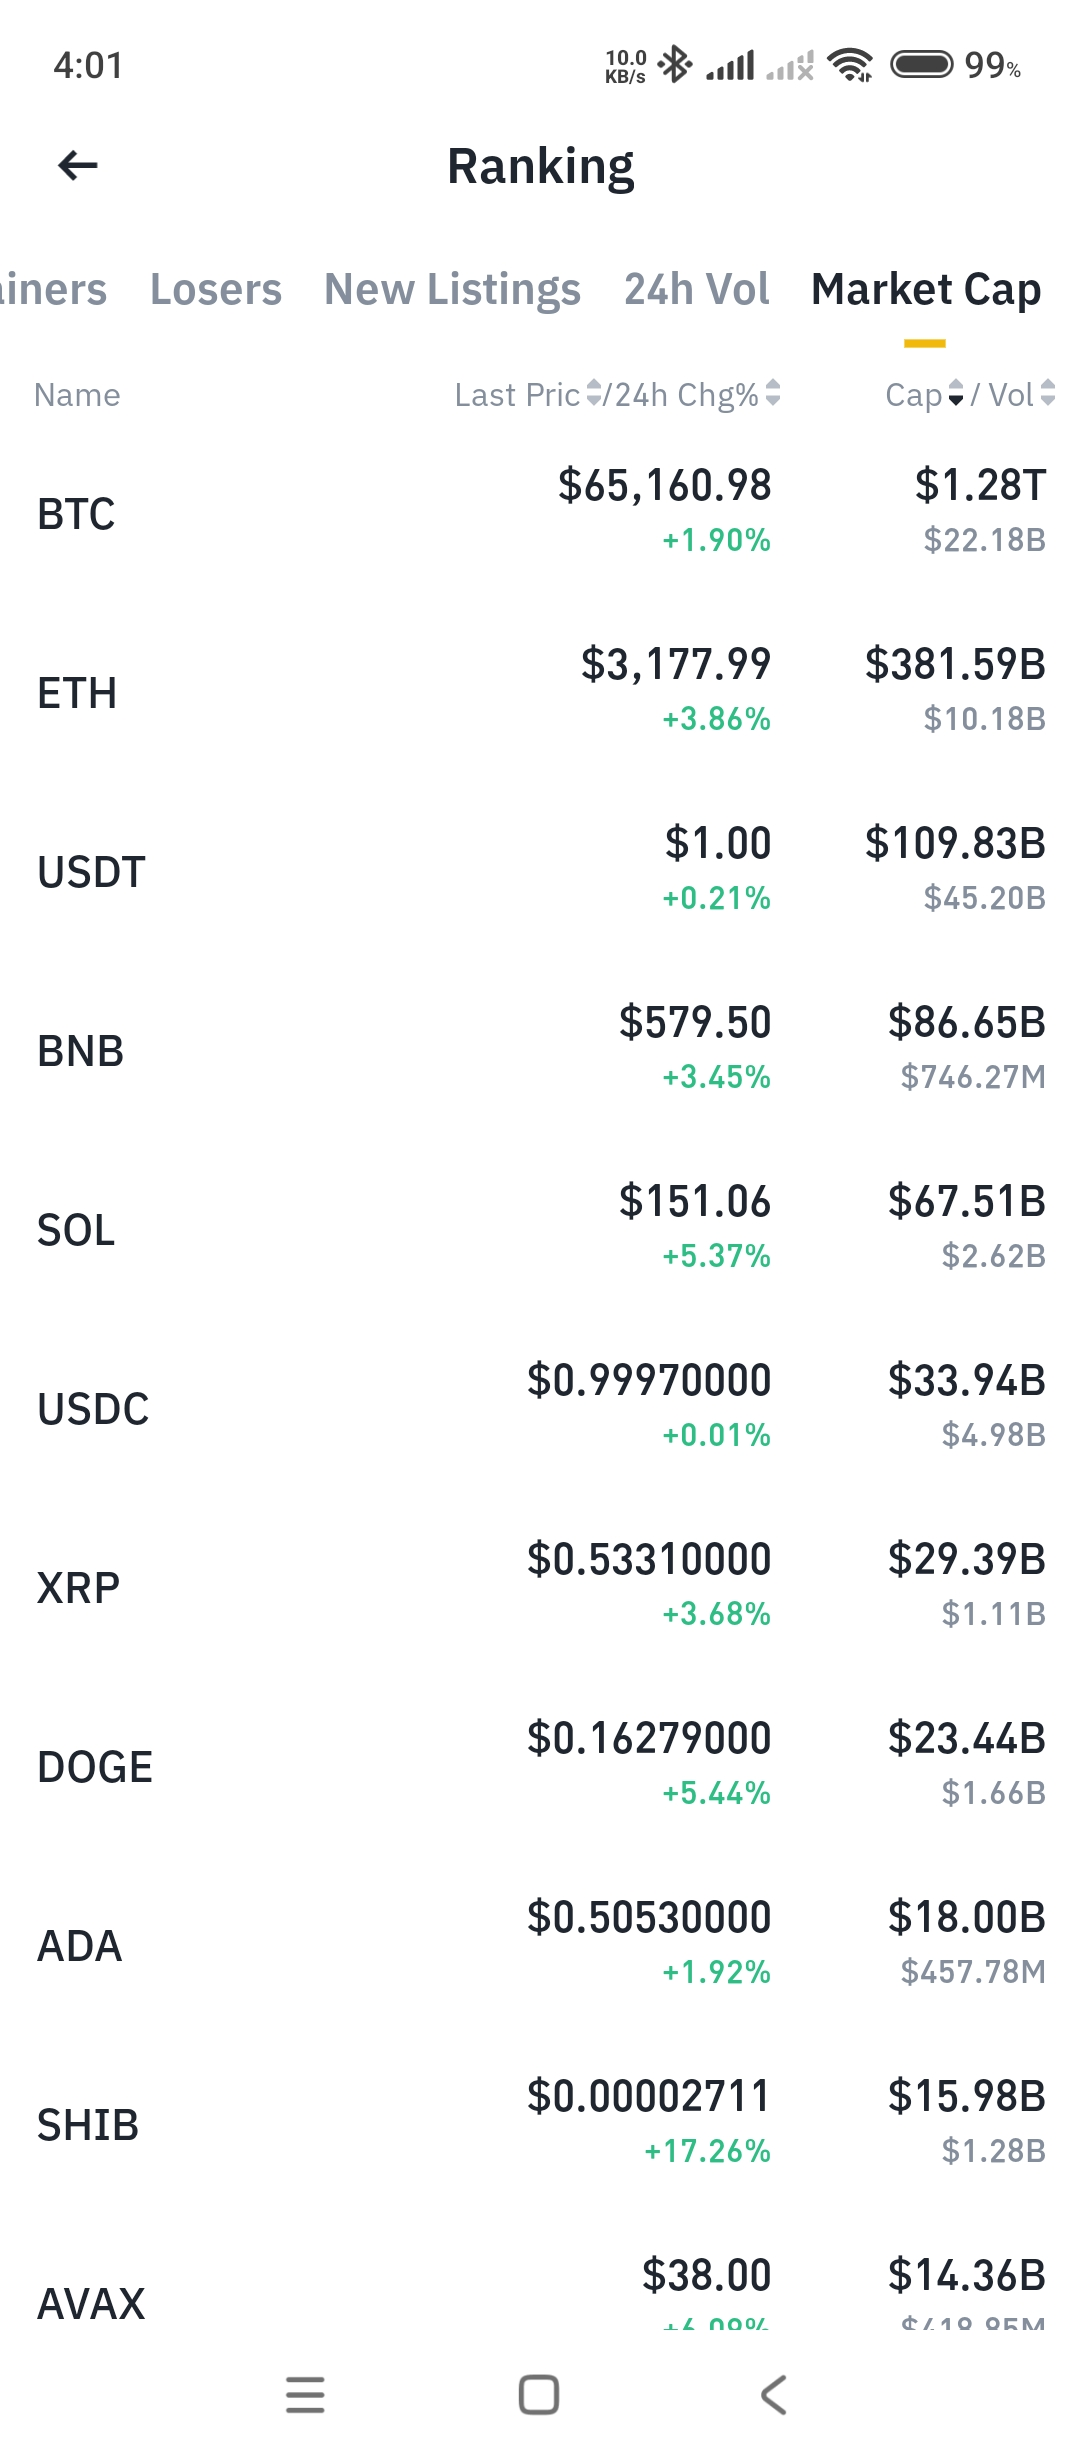
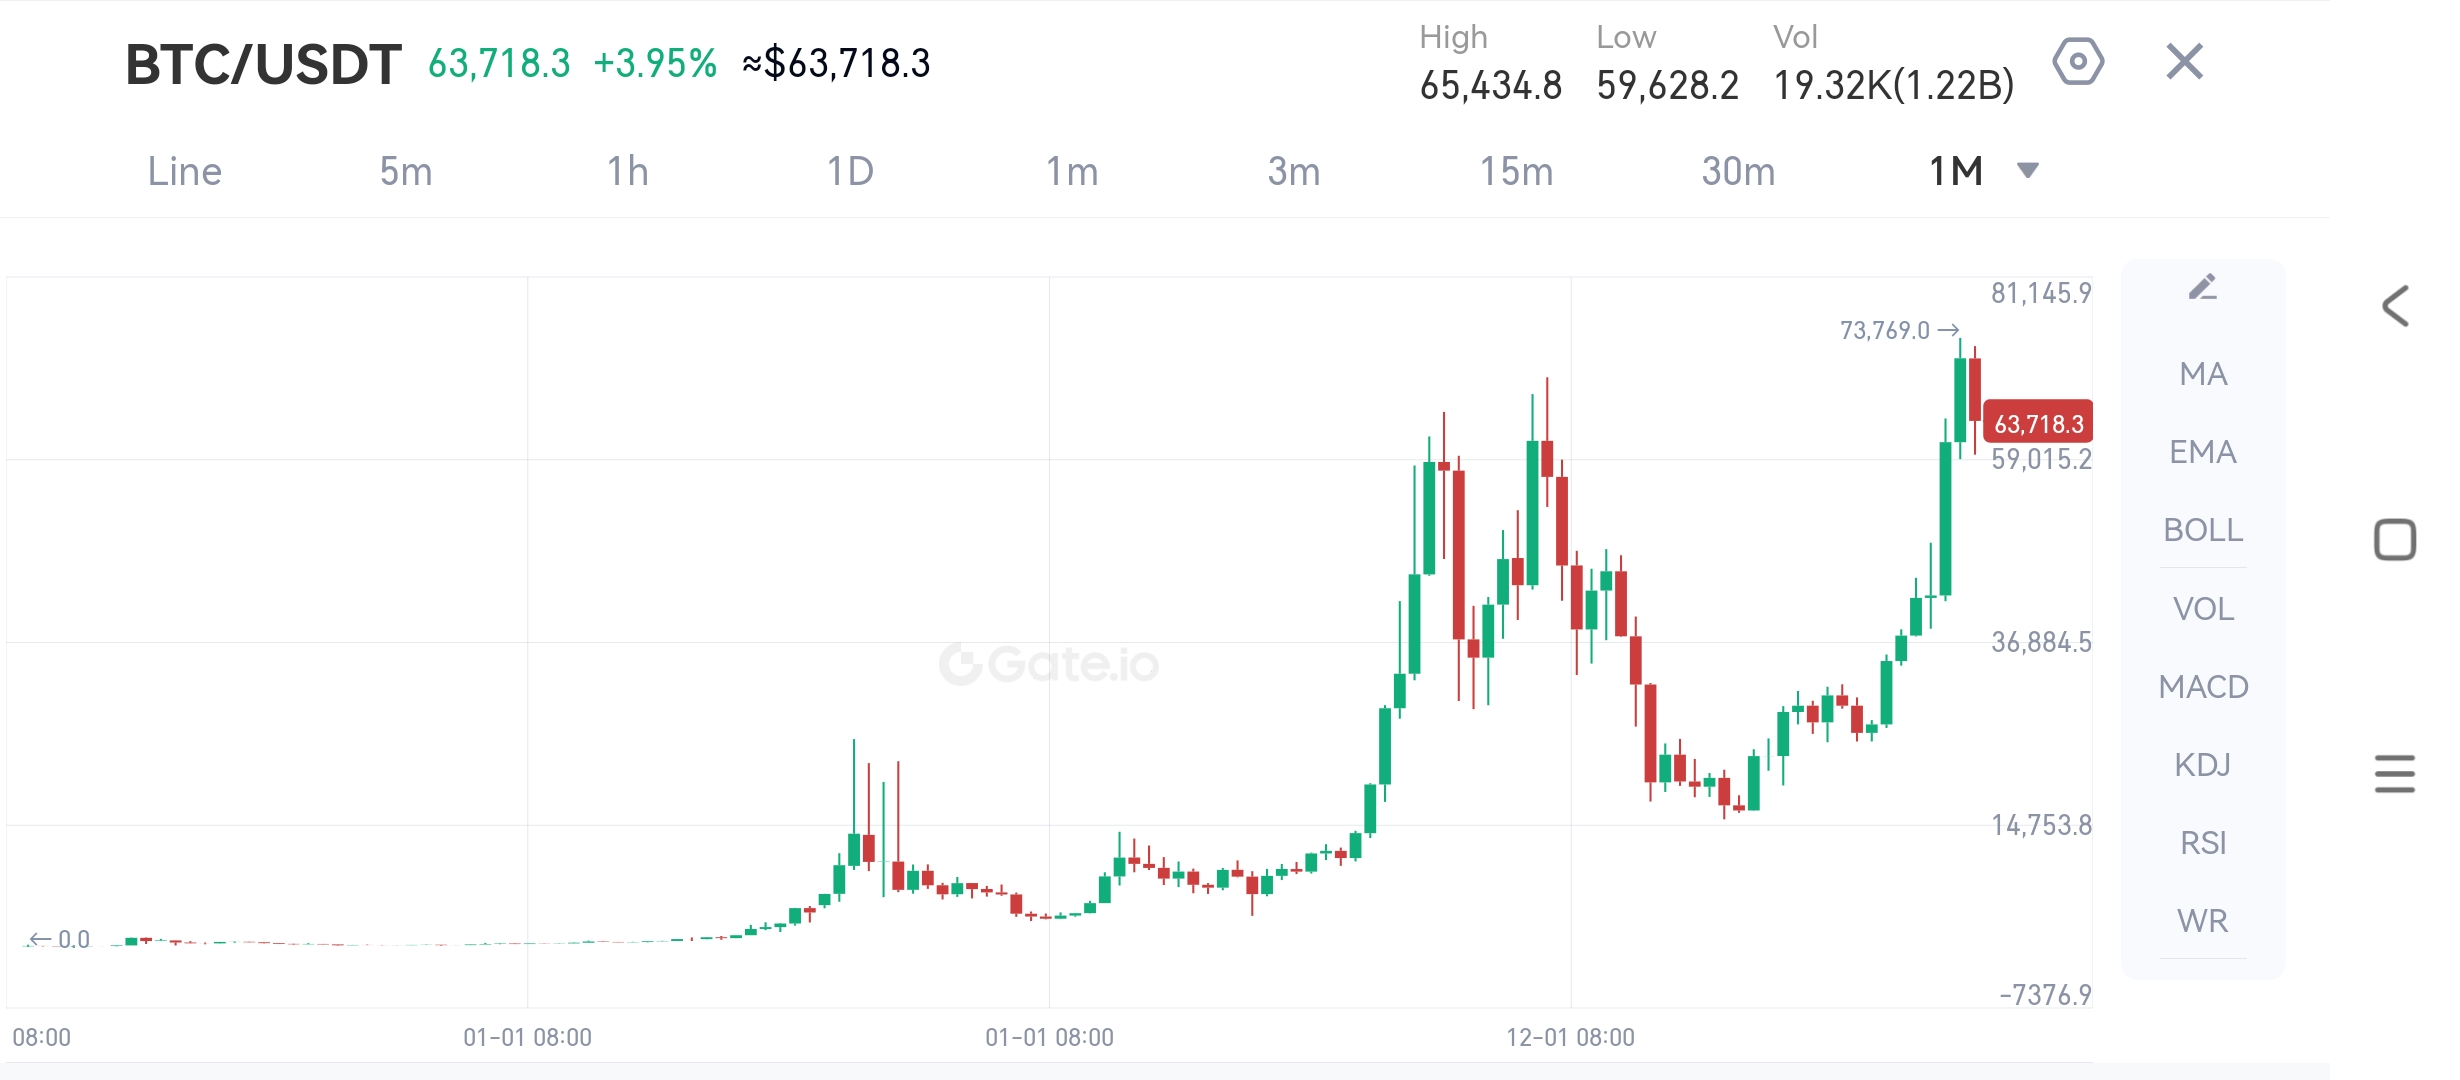
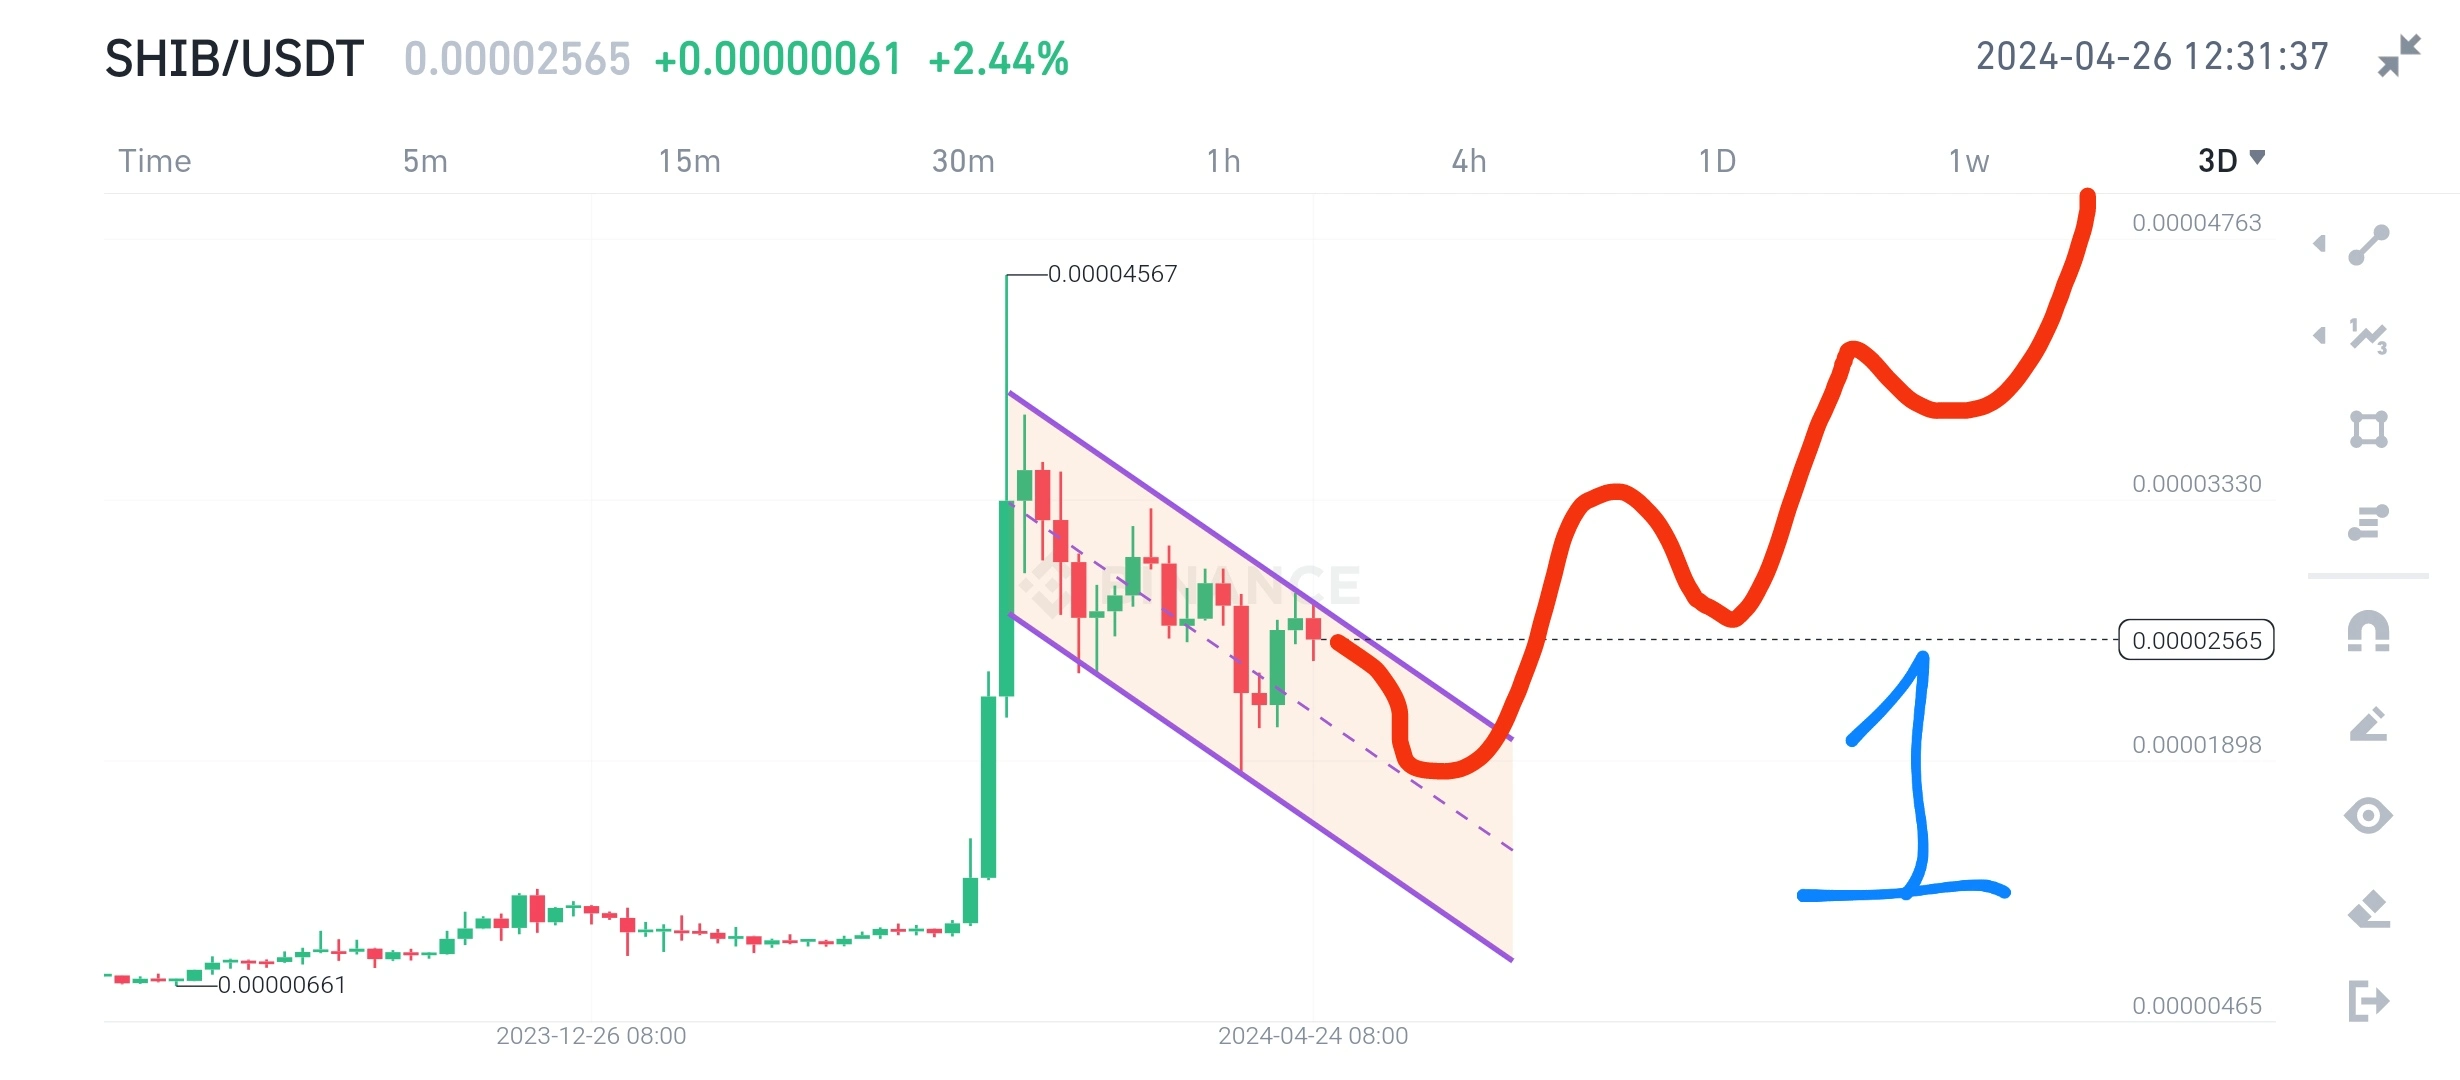
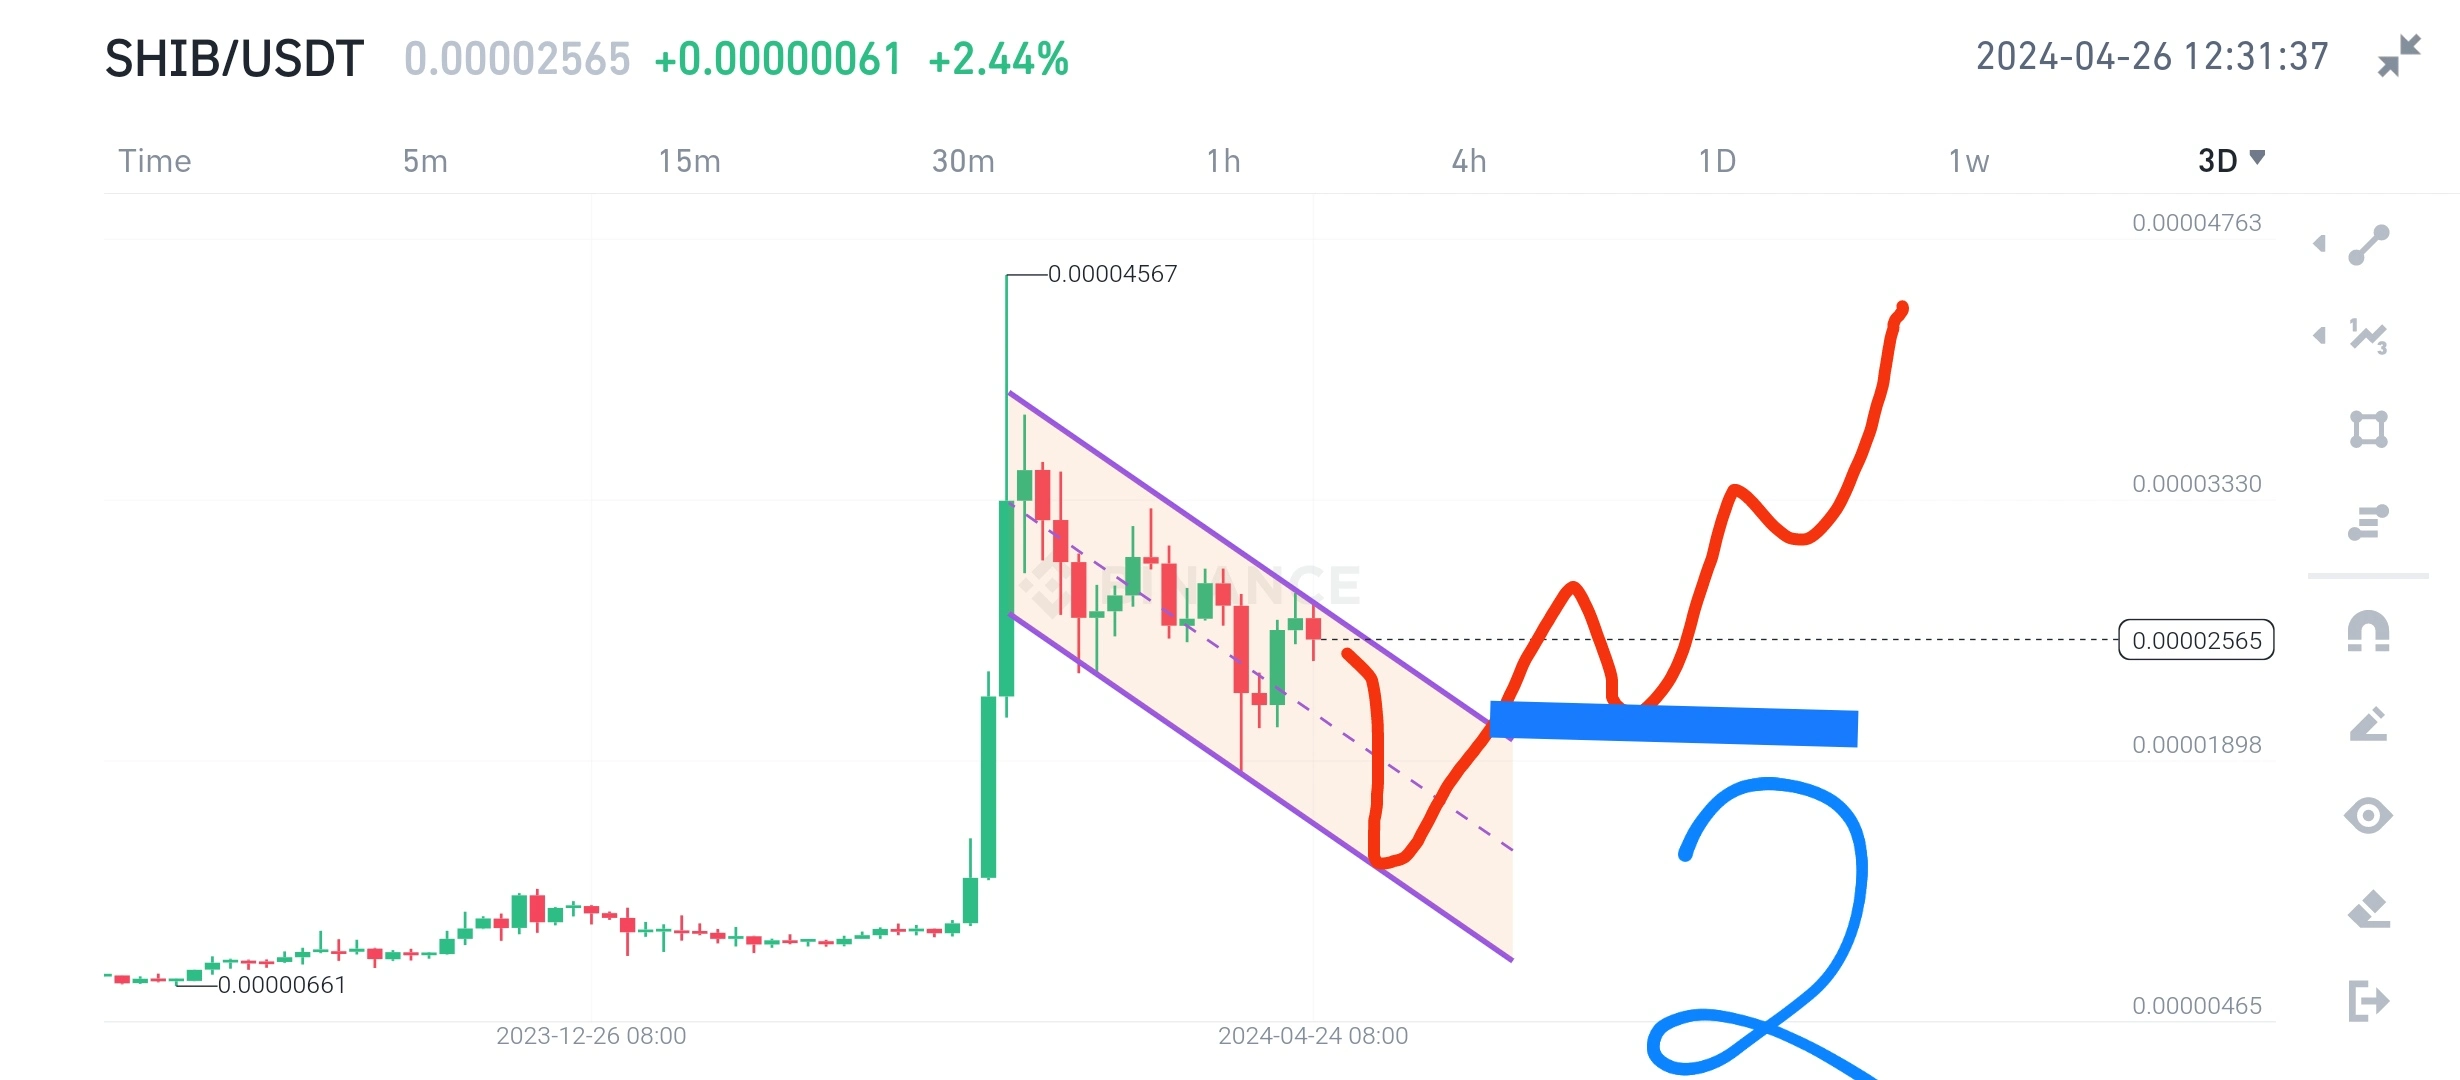
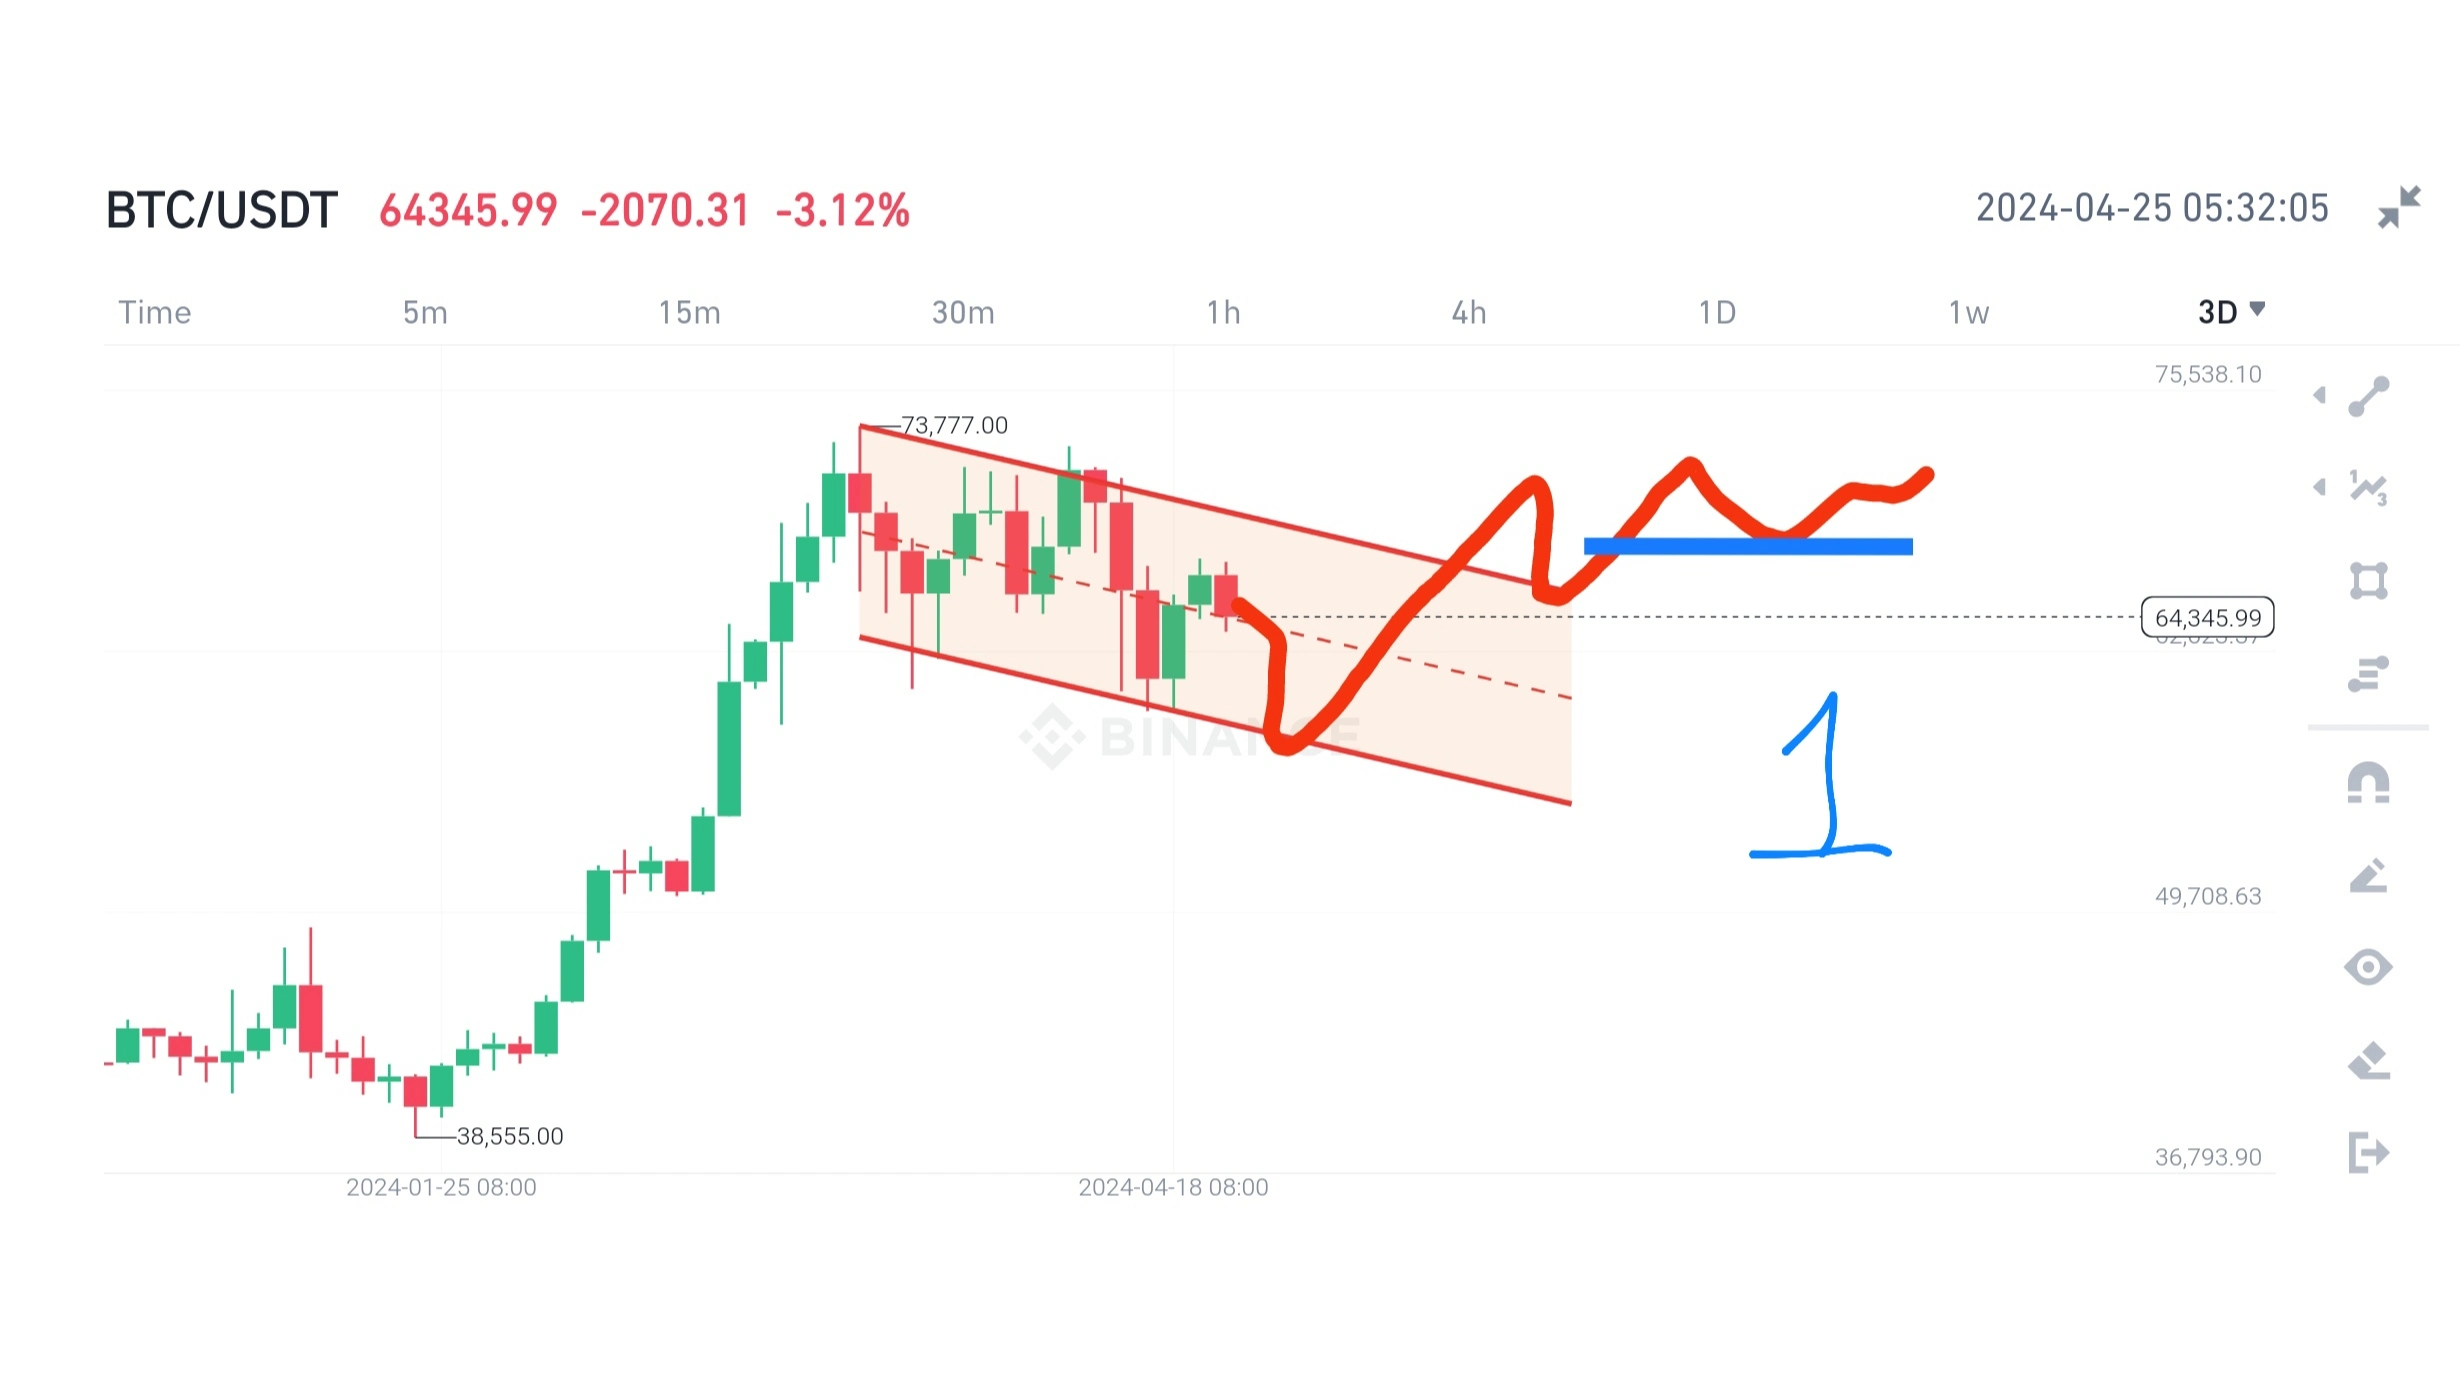
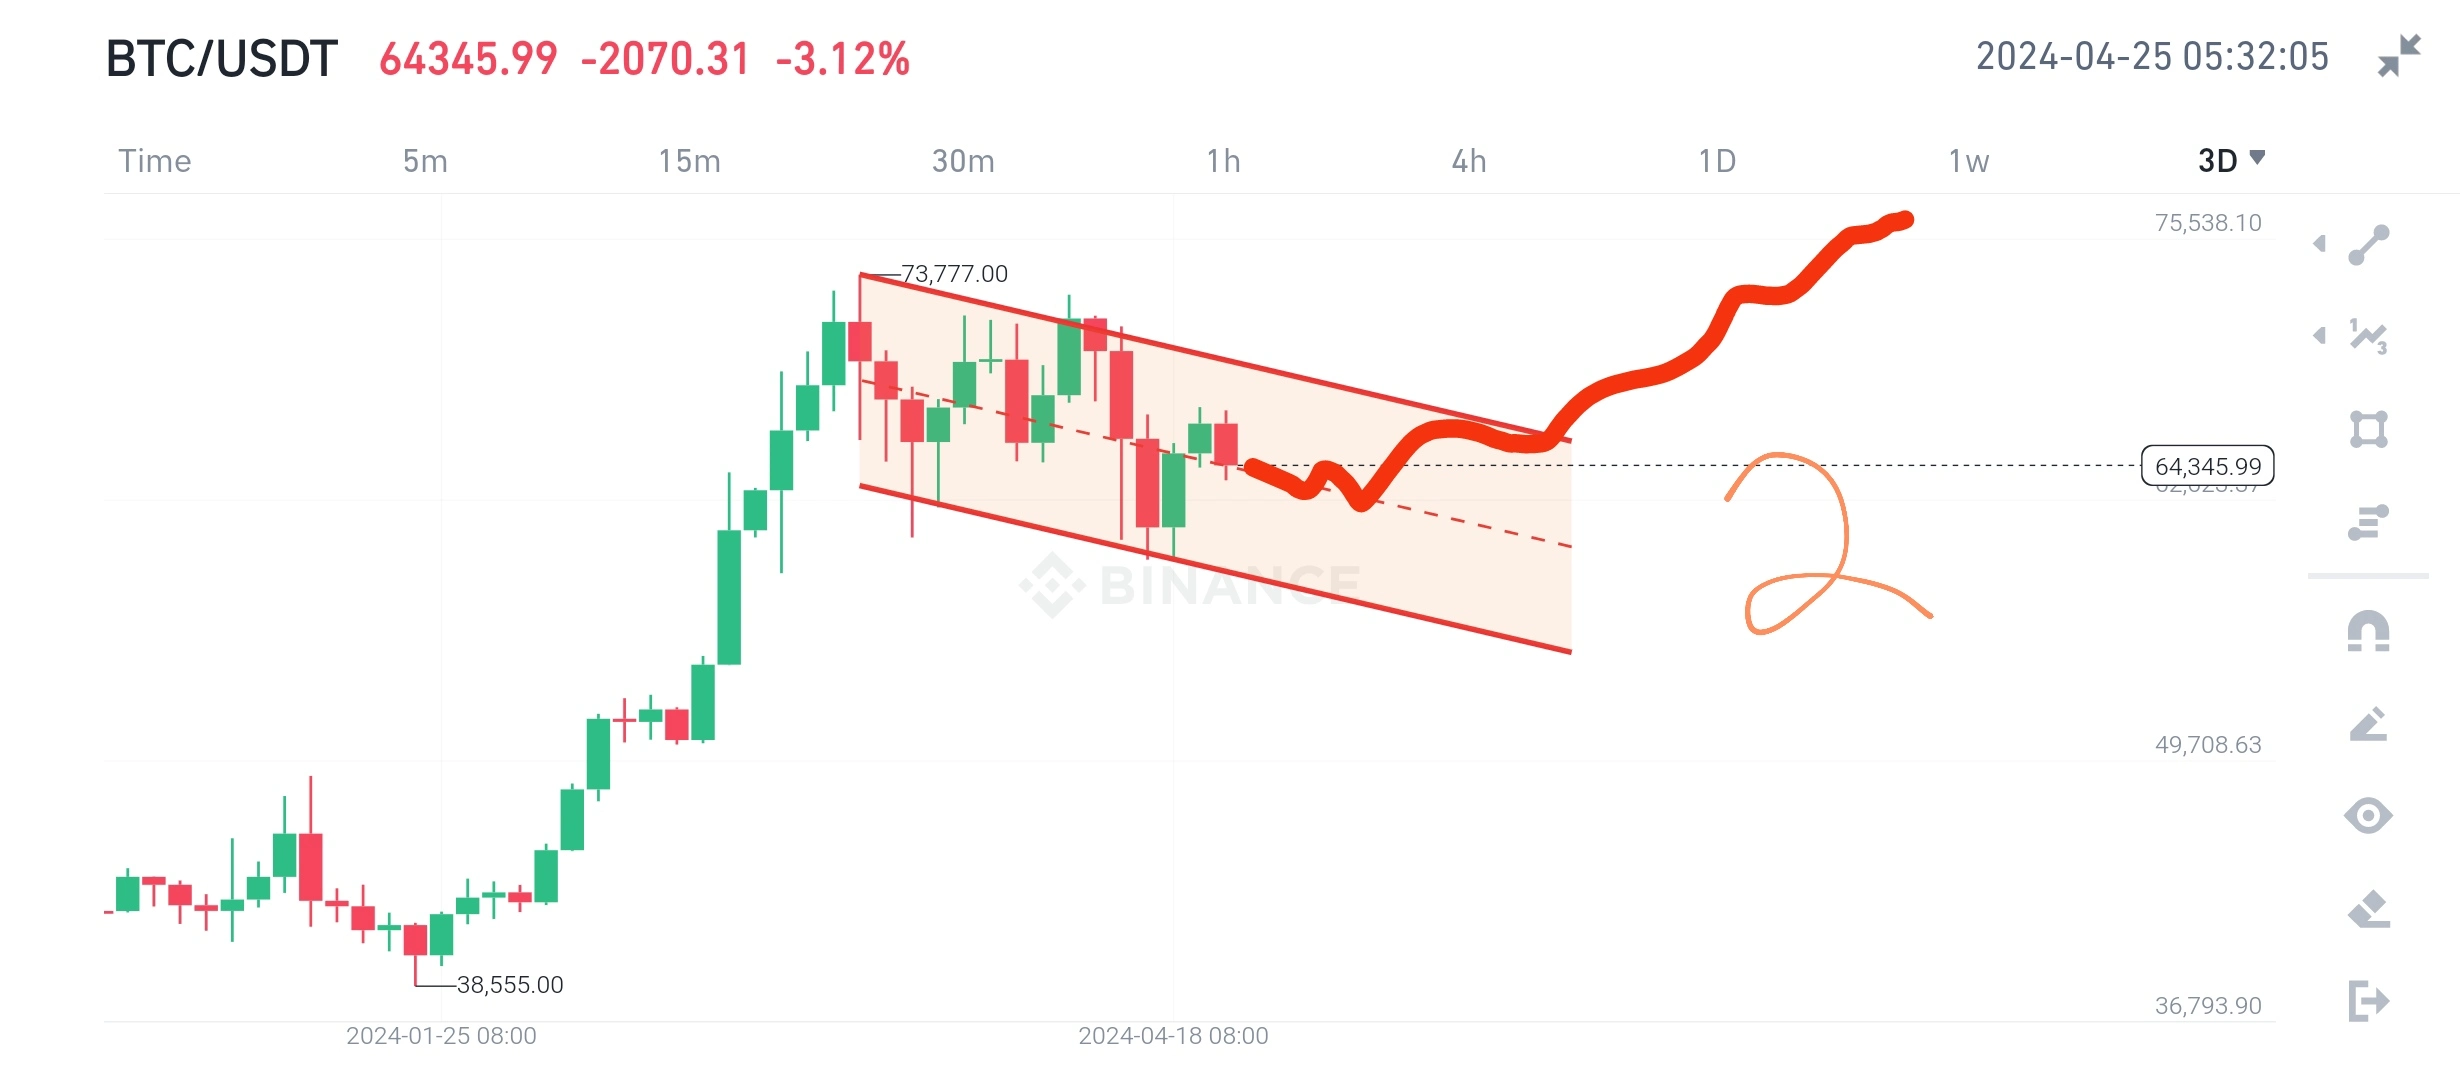
3. **Bitcoin Price Fluctuations**: Bitcoin's price fluctuated, dipping below $60,000 twice in April but rebounding near $65,000, indicating a potential price rebound.
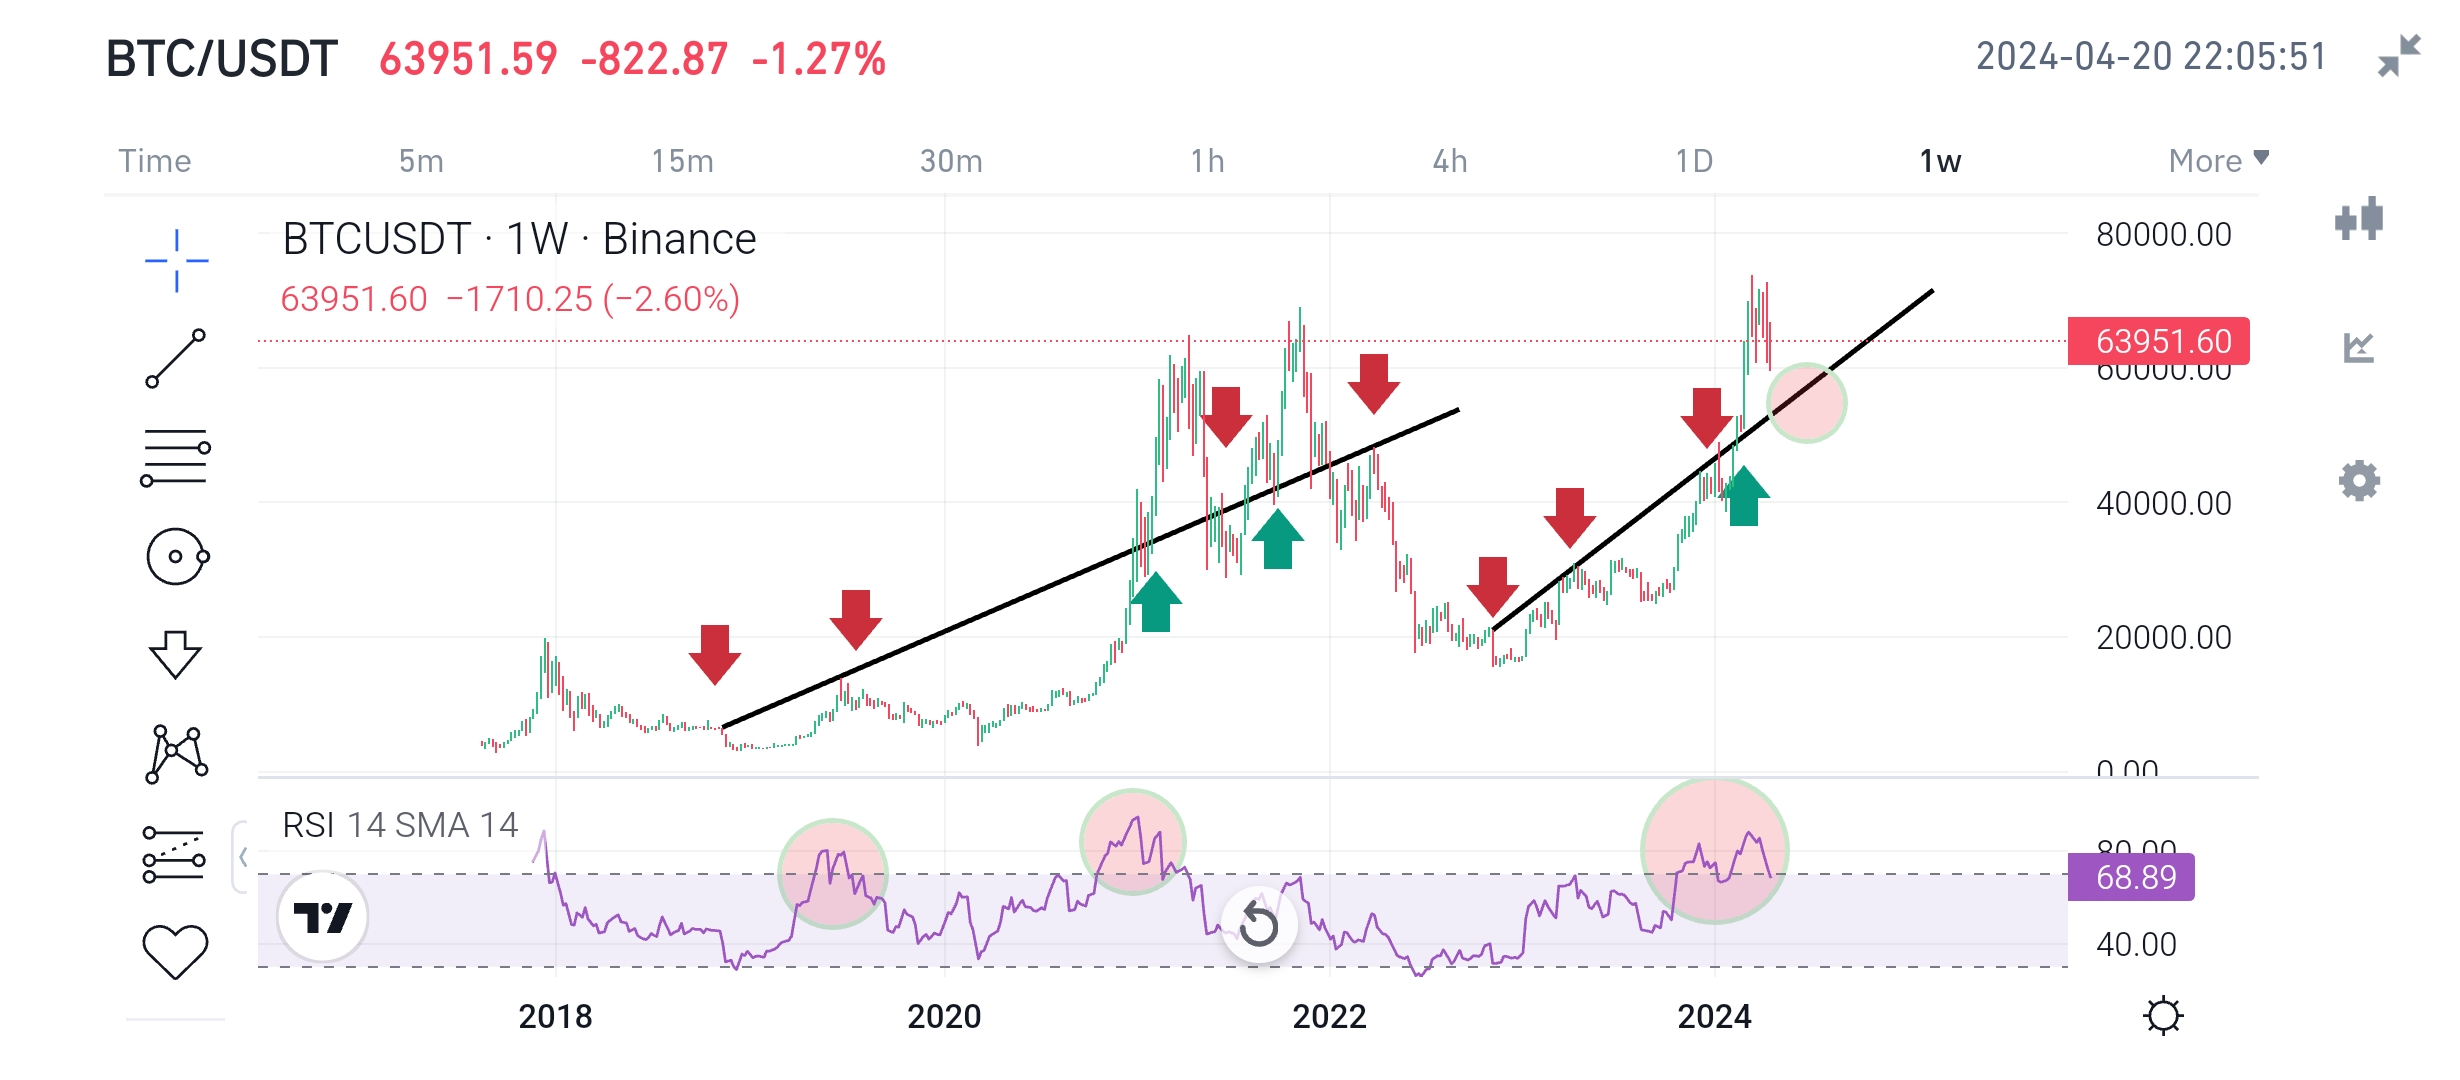
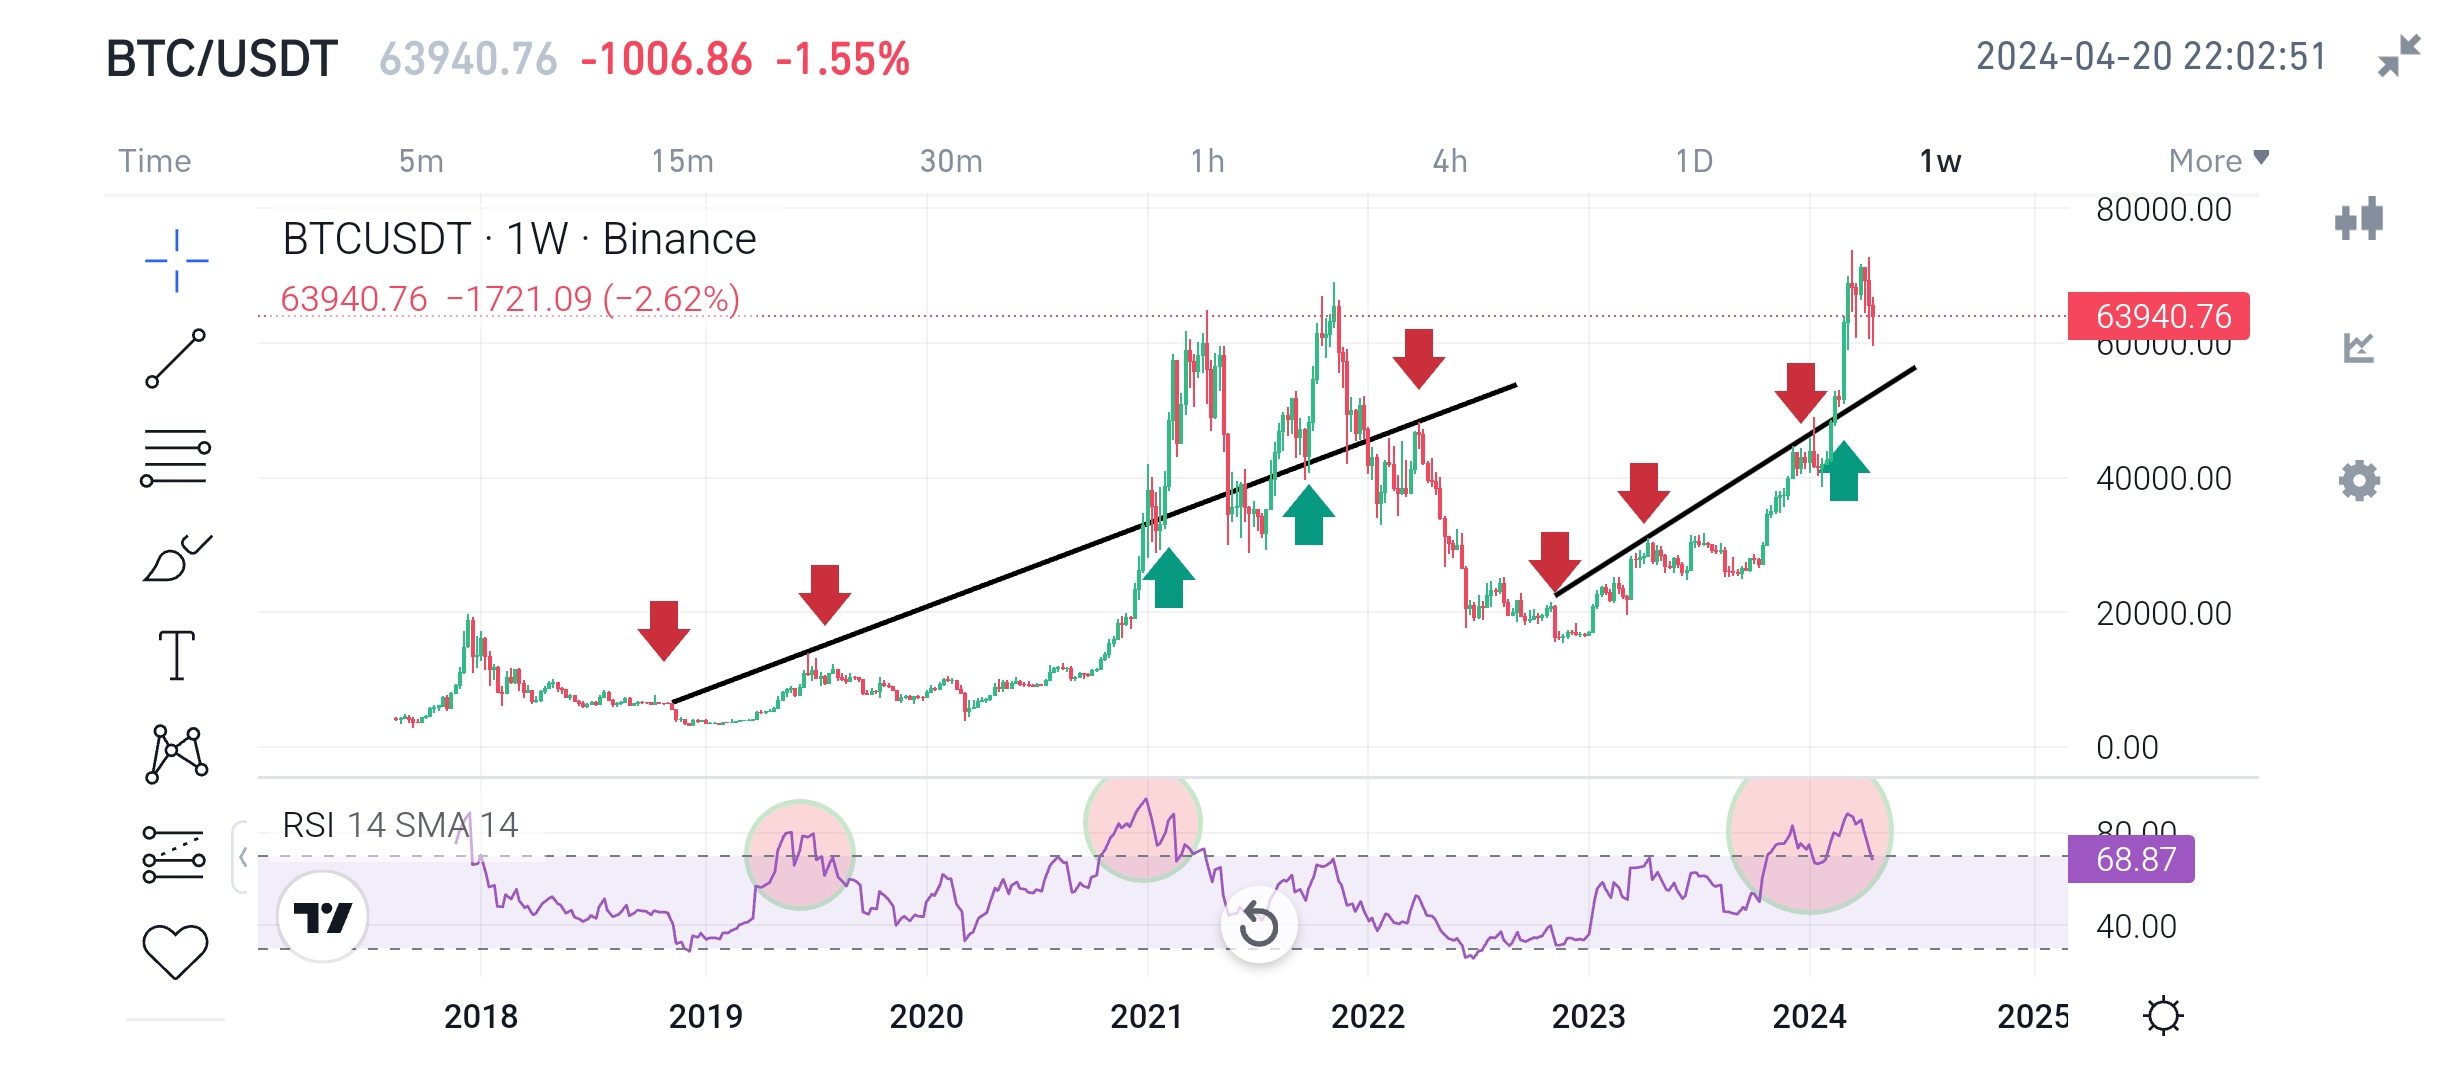
4. **Technical Indicators**:
BTC-1.7%
SOL-3.09%
  • Reward
  • 1
  • Share
#BTC#
🔊📢🚨Realistic Price prediction during peak bull run based on current market cap and prevous historical data.
$BTC 110000-120000 that is 85-85% of current price (needed market cap approximately 2.1-2.3T)
$ETH 10000-11000 that is 300-350% ( market cap approx. 1-1.2T)
$BNB1200-1500 that is 200-300% (MC: 180-220B)
$SOL 300-400 that is 200-300% (MC:130-160B)
$DOGE 0.64-0.8 that is 400-500% (MC:92-108B)
$SHIB 0.00008-0.0001 that is 300-380% (MC:48-60B)
$AVAX 110-150 that is 300-400% (MC:46-60B)
$FET 7-10 that is 300-400% (MC:8-10B)
$INJ 120-150 that is 400-500% (MC:12-15B)
$RNDR 32-40 that
BTC-1.7%
ETH-4.48%
BNB-1.59%
SOL-3.09%
post-image
  • Reward
  • Comment
  • Share
#BTC#
🚨✅📢 $BTC price analysis using data ad figures from history.
i) Trend line
Two trend lines are drawn using a similar pattern The left side trend line in black color representing a resistance during the bear market. Whenever $BTC touched the line it quickly moved downward or the dump started. At 3 different locations touched the lines and dumped red arrows pointed out those. When $BTC broke that line the real bull market started as at that time it broke previous all time high(ATH). Green arrows show where it broke the resistance and then the same resistance becomes support during the b
BTC-1.7%
NEVER-6.26%
TOKEN-4.77%
post-image
post-image
  • Reward
  • 2
  • Share
Kurukahvevip:
According to the chart, it will drop to an average of 50K this year. 🥸
View More
Is this your 1st, 2nd, 3rd, or 4th Halving ⁉️Reply with yes or no beacuse
🔥 Ahead lie years of innovation and anticipation.
✅ Remember to zoom out once in a while we're still early in this journey.
🎊 Keep growing, keep building, keep learning.
❤ The countdown to the next Halving starts now!
Press Follow for see information and updates. Thank you
#HotTopicDiscussion# #ContentStar# #比特币# #BountyCreator# #BTC#
BTC-1.7%
  • Reward
  • Comment
  • Share
#BTC#
🔥🔥Bitcoin Price: 2010-2024🔥🔥
✅ 2010: $0.003
✅ 2011: $0.30
✅2012: $5.29
✅ 2013: $13.35
✅2014: $771
✅2015: $315.1
✅ 2016: $998.5
✅ 2017: $13,895.2
✅2018: $3,731.75
✅ 2019: $7,170.11
✅2020: $29,385.24
✅ 2021: $69419.5
✅2022: $47798.5
✅2023: $43453.3
✅The Story in 2024 is 73769.24(this year peak till now) Will it go up or down? Probably yes in both cases. This bull season is a season with high volatility. Show patience for gains. Also don't be too greedy.
Presented data shows approximate figures and may be slightly different that depends upon cex/dex. Considering high volatility of bitco
BTC-1.7%
SHIB-1.24%
SOL-3.09%
post-image
  • Reward
  • Comment
  • Share
#DOGE#
✅✅Data Checks and Facts are very important to understand market situations.🔥🔥🔥
i)$BTC market cap dropped from 1.3T to 1.22T ($80B from the recent bull market top)
ii) $ETH market cap dropped almost 400b to 360b($40b drop from the recent top)
iii)$BNB market cap dropped from $92B to 80$(12$ drop from recent top)
iv) $SOL market cap dropped from $72b to $59b
($13b drop from recent high)
v) #Dogecoin‬⁩# market dropped from $27b to $20b
($7b drop from most recent top)
vi) #SHIB# market dropped from $18.8 to $12b
($6.6b drop from recent top)
vii) #WIF# market dropped from $4.87b to $2.24b
DOGE-2.92%
BTC-1.7%
OP-1.58%
post-image
  • Reward
  • Comment
  • Share
#INJ#
$LUNA vs $INJ price movement analysis.
In the last bull market $LUNA outperformed the market and did more than 1000x. Now we have our eyes on #INJBullrun which is already up about 13x from the bottom. Looking at recent trends, project development and updates, community building and team. #INJTECTIVE will probably do another 10-20x in the next leg up. It is important to mention # InjectiveCoin did more than 10x during the bear market. #Luna market goes up to 119billion in the last bull market. If we compare the market cap of # INJTECTIVE at the movement it is only 2.6billion. So, consideri
INJ-3.07%
LUNA-0.39%
BAG20.62%
post-image
  • Reward
  • Comment
  • Share
  • Topic
    1/3
  • Pin
Trade Crypto Anywhere Anytime
qrCode
Scan to download Gate app
Community
English
  • 简体中文
  • English
  • Tiếng Việt
  • 繁體中文
  • Español
  • Русский
  • Français (Afrique)
  • Português (Portugal)
  • Bahasa Indonesia
  • 日本語
  • بالعربية
  • Українська
  • Português (Brasil)