
🔐 WalletConnect and the future of Web3 wallets: security, integration, and rewards 🌐💎
In the Web3 world, wallets are not just a storage for cryptocurrencies 🪙, but a key tool for securely managing private keys 🔑 and interacting with decentralized applications. Through WalletConnect, users can connect to any blockchain 📡 and use services without losing control over their assets.
💼 The Role of Wallets in the Network
Wallets integrate with the WalletConnect Network, providing a convenient and secure interface for managing digital assets and making transactions 💳⚡️. Today, Reown offers Wal
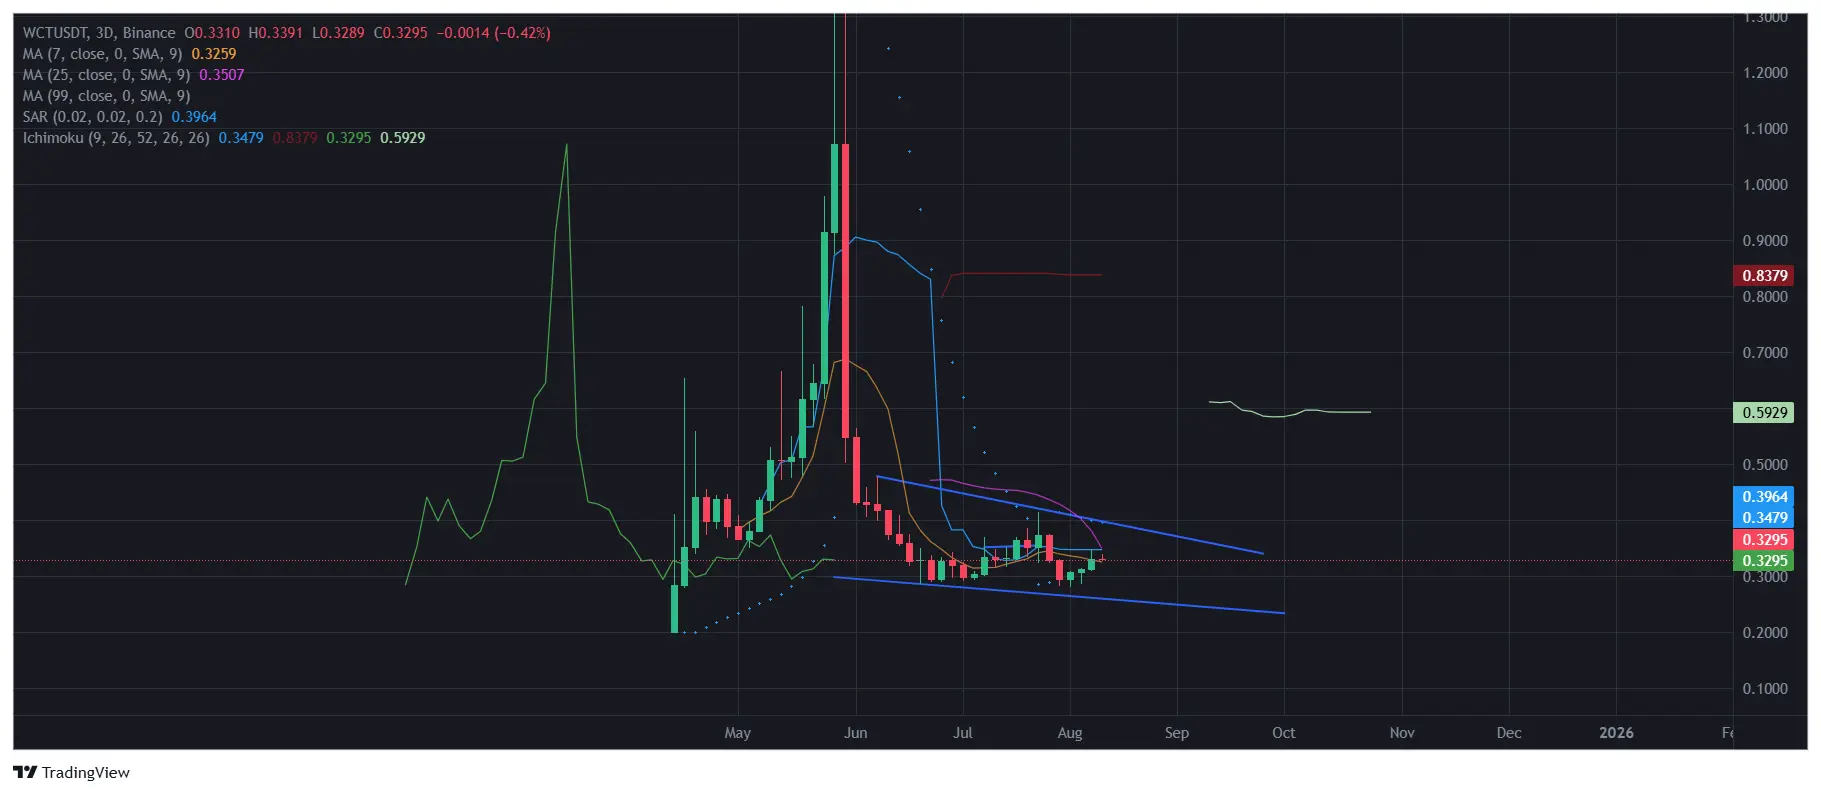
WCT-0.76%
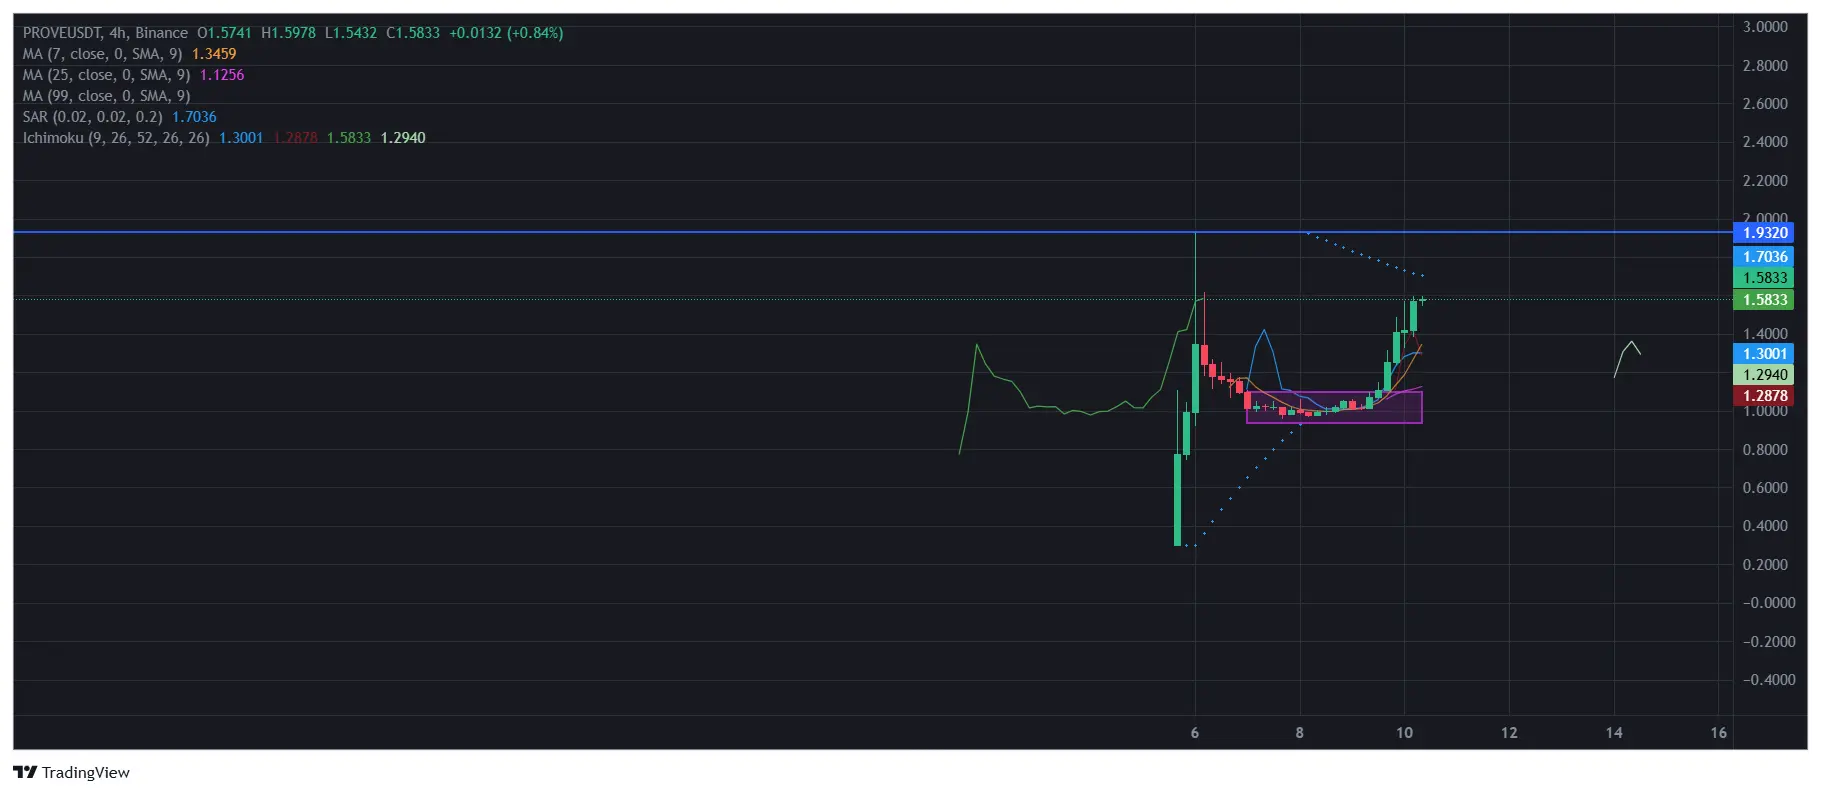
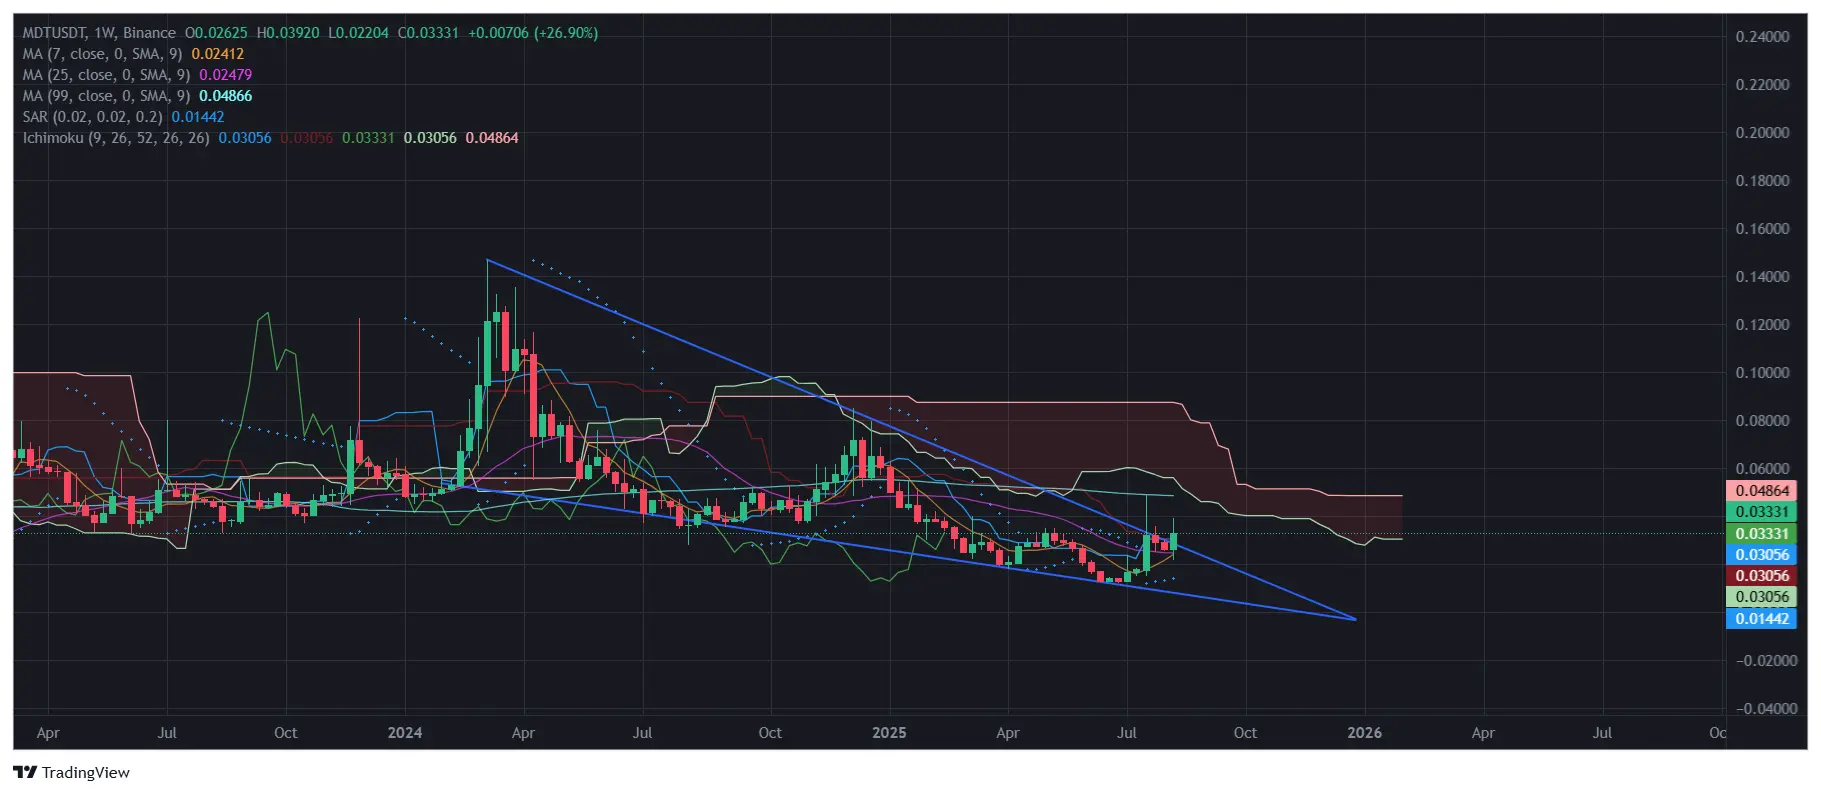
[The user has shared his/her trading data. Go to the App to view more.]